Google Sheets Add-on Guide
The Similarweb Google Sheets Add-on allows you to bring Similarweb’s digital intelligence directly into your spreadsheets. Use custom formulas to pull real-time web traffic, engagement, keyword, and geographic data.
Installation and Setup
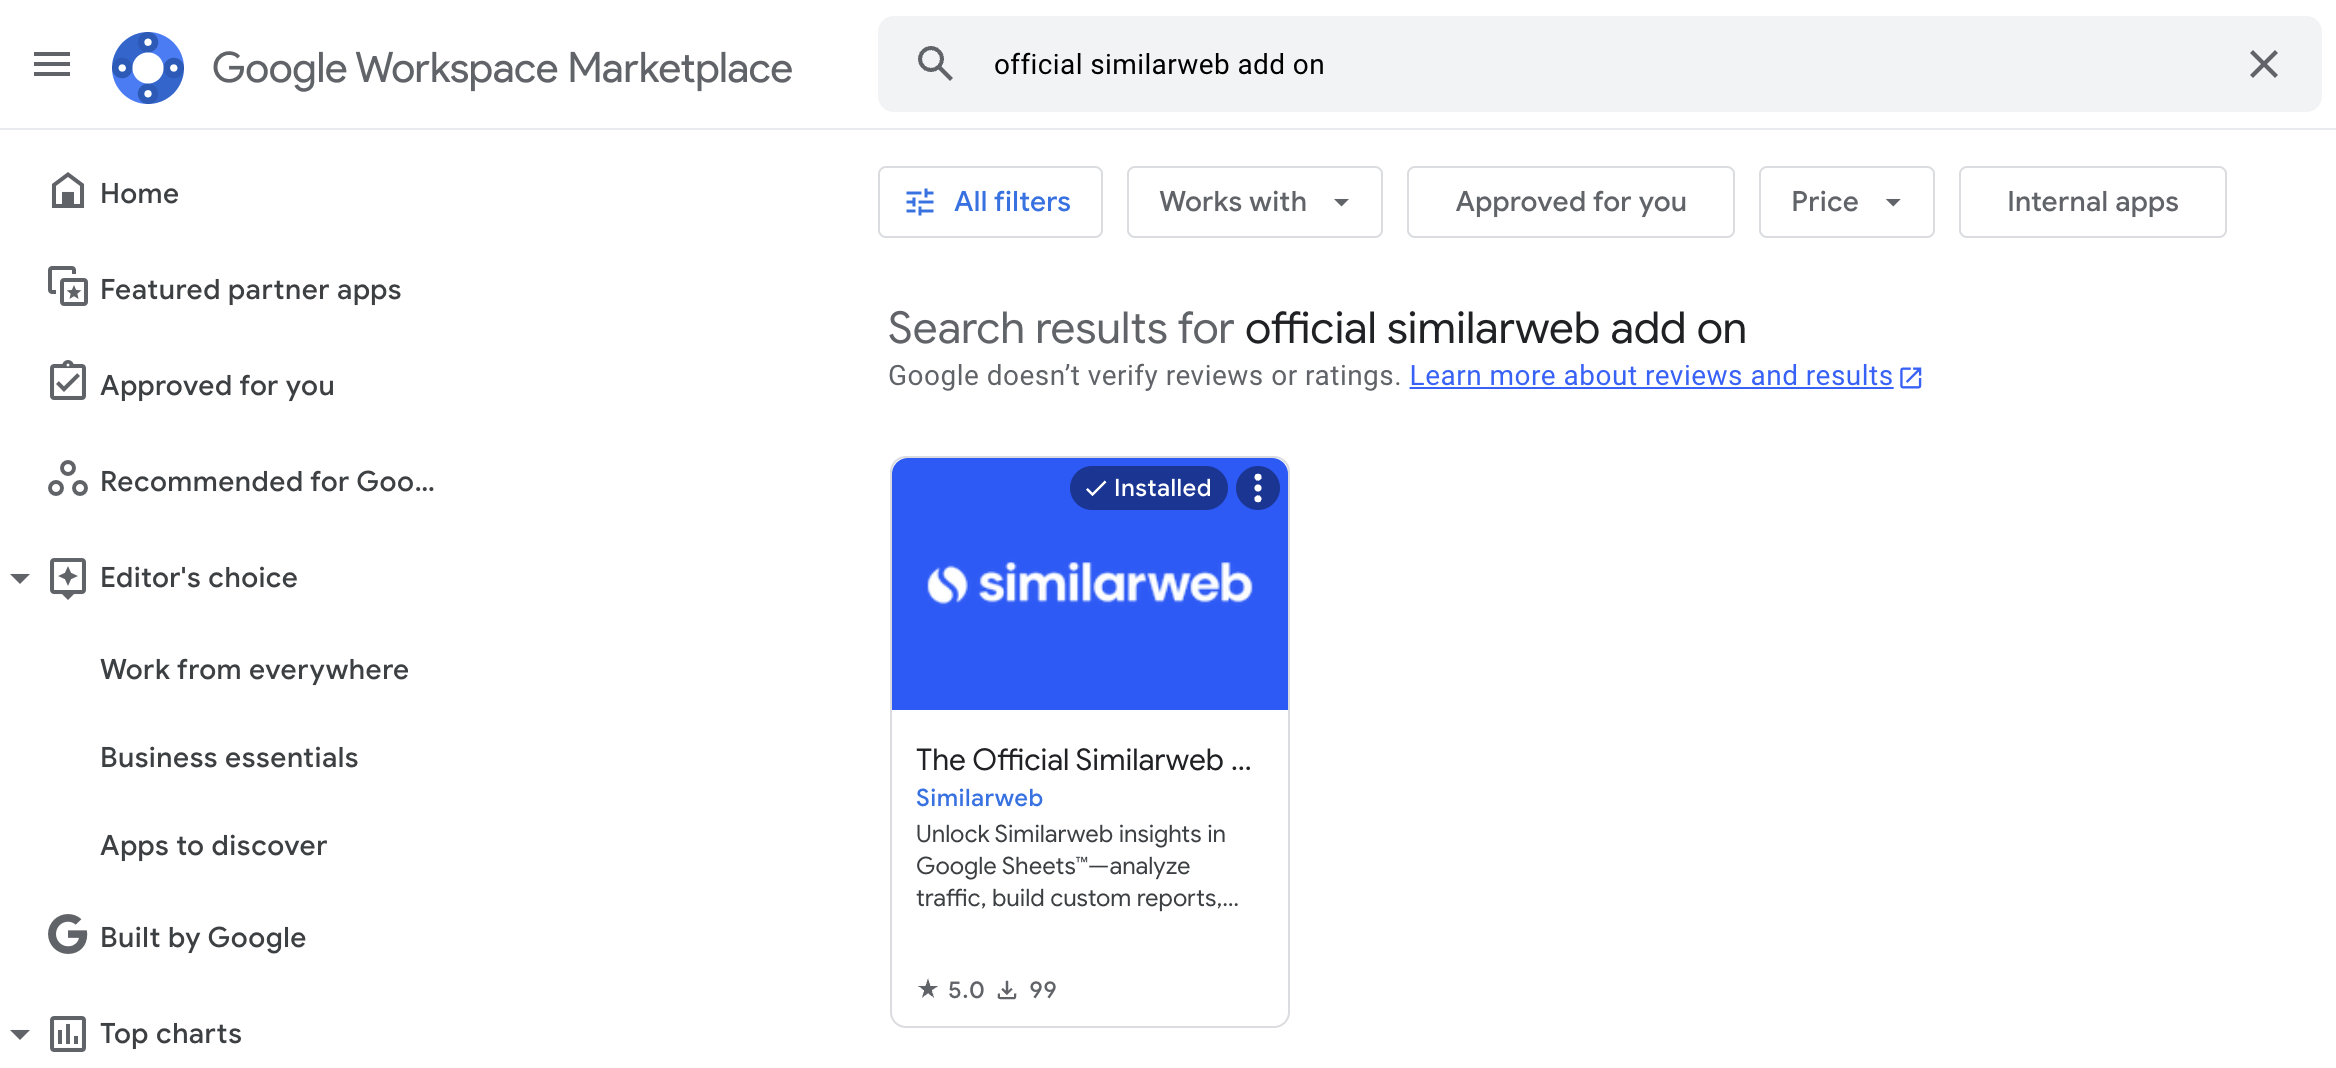
You can install the Add-on via the Google Workspace Marketplace.
Option 1: From Google Workspace Marketplace
Search for Similarweb, click Install, and follow the prompts.
Option 2: Directly from Google Sheets
- Open any sheet
- Go to Extensions > Add-ons > Get add-ons
- Search for Similarweb and install
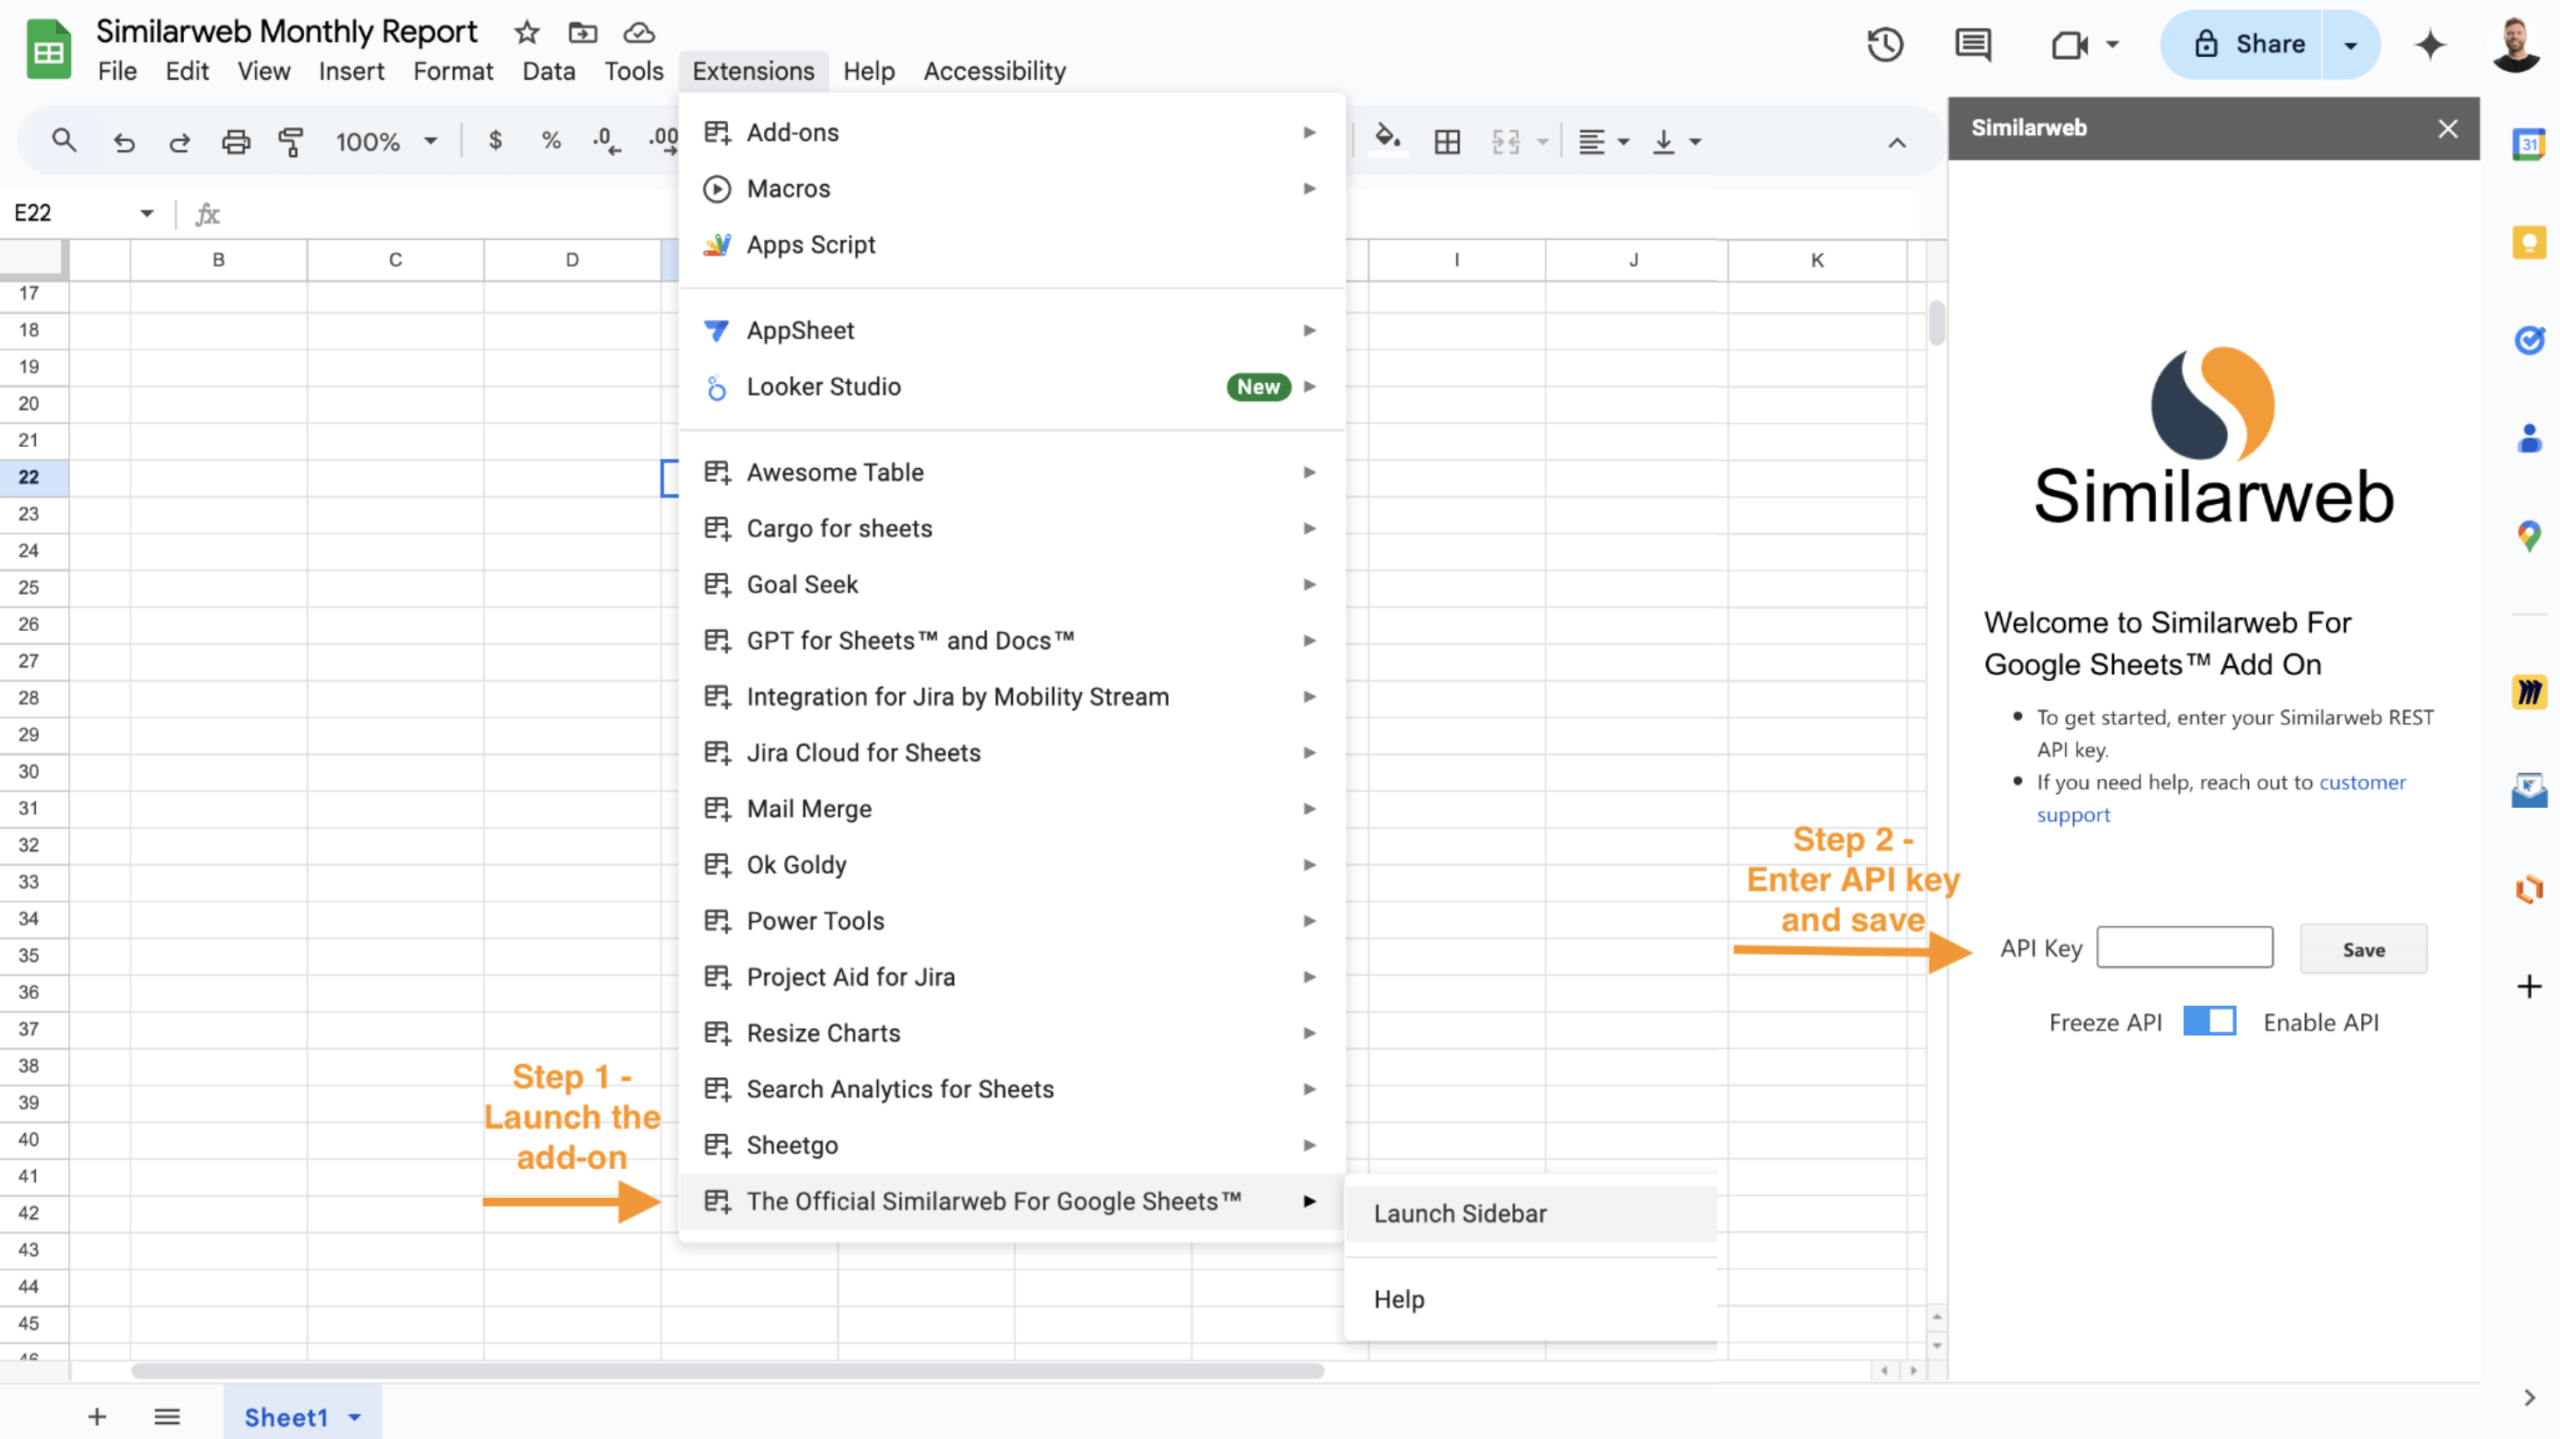
Authenticate with Your API Key
- Go to your Account Settings > REST API
- Copy your API key
- In the Similarweb add-on sidebar, paste your key
- Click Save to activate
Discover Available Formulas
The first step we recommend you take is to explore all supported datasets and formulas, type this formula into any cell:
=SIMILARWEB_GET_ALL_FUNCTIONS()This will return a full list of grouped formulas—covering traffic, geography, keywords, rankings, marketing channels, and more.
Click on any function in the output list to preview its parameters and rules, including accepted date formats, geo codes, metric options, and required fields.
Retrieving Data in Google Sheets
Instead of querying individual metrics, the new structure uses 10 grouped functions—each one supporting multiple metrics via a single call.
Example: Traffic & Engagement
=SIMILARWEB_WEBSITES_TRAFFIC_AND_ENGAGEMENT("cnn.com","2025-01","2025-04","monthly","total","us","visits,bounce_rate,page_views,average_visit_duration,pages_per_visit,unique_visitors")This retrieves traffic and engagement data for cnn.com in the US from January to April 2025.
Parameter Guide
| Parameter | Description |
|---|---|
| domain_name | Website domain (e.g., "cnn.com") |
| start_date / end_date | Format: "YYYY-MM" or "YYYY-MM-DD" |
| granularity | "daily", "weekly", "monthly" (default: monthly) |
| web_source | "total", "desktop", "mobile_web" |
| country | ISO code (e.g., "us", "gb", "ww") |
| metrics | Comma-separated list: visits, bounce_rate, page_views, average_visit_duration, pages_per_visit, unique_visitors. Leave blank to pull all. (recommended: specify desired metrics to future-proof your reports) |
| mtd | TRUE/FALSE — include month-to-date values |
| main_domain_only | TRUE to exclude subdomains |
| aggregation | Aggregate over the date range: SUM, AVG, MIN, MAX, MEDIAN, FIRST |
| return_values_only | TRUE to return only the raw values (no headers or dates) |
Default Behavior
- If no dates are provided → latest available data will be used for daily and monthly granularity. Weekly requires exact start and end dates.
- If 'metrics' is not specified → all available metrics will be returned.
Advanced Examples
These examples demonstrate how to use Similarweb formulas with specific parameters to pull the exact insights you need. In the examples below, the last field in the formula will be the relevant field.
1. Choose Specific Metrics
Use case: Pull only the traffic and engagement metrics you need, rather than returning the full default set.
Relevant field: metrics
Example:
=SIMILARWEB_WEBSITES_TRAFFIC_AND_ENGAGEMENT("cnn.com","2025-01","2025-04","monthly","total","us","visits,bounce_rate,page_views,average_visit_duration,pages_per_visit,unique_visitors")2. Aggregate Results Across Time Range
Use case: Summarize multiple months into a single value using median (or other aggregations like SUM, AVG).
Relevant field: aggregation - Use "MEDIAN", "SUM", etc., to condense the time period
Example:
=SIMILARWEB_WEBSITES_TRAFFIC_AND_ENGAGEMENT("cnn.com","2025-01","2025-04","monthly","total","us","visits,bounce_rate,page_views,average_visit_duration,pages_per_visit",,,,"MEDIAN")3. Values Only (No Headers)
Use case: Output only the numeric results - no column labels or date headers. Ideal for embedding into existing reports.
Relevant field: return_values_only - Set to TRUE() to exclude labels and dates
Example:
=SIMILARWEB_WEBSITES_TRAFFIC_AND_ENGAGEMENT("cnn.com","2025-01","2025-04","monthly","total","us","visits,bounce_rate,page_views,average_visit_duration,pages_per_visit",,,,"SUM",TRUE())4. Limit Results (Top Geography)
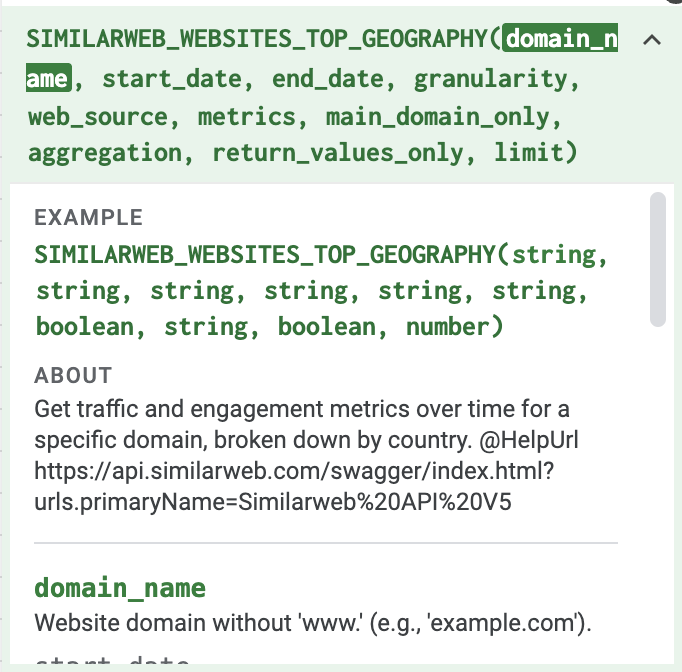
Use case: Pull the top countries driving traffic, limited to a specific number of rows.
Formula used: SIMILARWEB_WEBSITES_TOP_GEOGRAPHY
Relevant field: limit - Caps the number of rows returned (e.g., 10)
Example:
=SIMILARWEB_WEBSITES_TOP_GEOGRAPHY("cnn.com","2025-01","2025-04","monthly","total","share,visits,rank,average_visit_duration,pages_per_visit,bounce_rate",,"sum",,10)5. Rolling Dates for Freshest Data
Use case: Get the latest available daily or monthly data without manually setting dates. Leave start_date and end_date blank.
Relevant field: start_date and end_date - Date fields need to be left blank to get the latest available data. If you set granularity to 'monthly' you will get 3 months of data. If you set granularity to 'daily' you will get 28 days of data.
Daily example:
=SIMILARWEB_WEBSITES_TRAFFIC_AND_ENGAGEMENT("cnn.com",,,,"daily","total","us","visits,bounce_rate,page_views,average_visit_duration,pages_per_visit,unique_visitors")Monthly example:
=SIMILARWEB_WEBSITES_TRAFFIC_AND_ENGAGEMENT("cnn.com",,,,"monthly","total","us","visits,bounce_rate,page_views,average_visit_duration,pages_per_visit,unique_visitors")Sharing & Ownership
ImportantAPI keys are tied to the owner of the Sheet. Anyone accessing the Sheet will use the owner's data credits.
✅ Best Practice for Sharing:
- Share as "View Only"
- Recipients must make a copy, install the add-on, and enter their own API key
You can also:
-
Use Freeze API Calls to prevent accidental usage
-
Or delete your key from the sidebar and click Save
Troubleshooting & Errors
| Error | Cause |
|---|---|
| # ERROR! (no response) | Invalid API key or domain |
| Data Not Found (404) | Unsupported domain or country |
| Invalid Country | Wrong country code |
| Blank Cell | Possibly return_values_only = TRUE with no data returned |
FAQ
What's the best way to get started?
Run =SIMILARWEB_GET_ALL_FUNCTIONS() to explore all supported formulas. Click on any function name to preview its parameters.
What metrics are available?
Metrics vary by formula group. For example, for traffic and engagement you can access: visits, bounce_rate, page_views, average_visit_duration, pages_per_visit, and unique_visitors.
Why should I specify metrics?
More metrics will be added over time. Specifying the ones you need ensures consistent output and helps future-proof your credit usage when new metrics are added.
What happens if I don't input dates?
You'll receive the latest available daily or monthly data by default. Weekly granularity requires start and end dates.
Can I limit the number of rows returned?
Yes, some functions like SIMILARWEB_WEBSITES_TOP_GEOGRAPHY support a limit parameter.
Can I schedule data refreshes?
Yes! Use Google Sheets' Apps Script to schedule refreshes based on your reporting needs.
Is the add-on free?
Yes, it's free for all Similarweb customers with API access.
How is usage billed?
Each API call consumes credits according to your subscription plan.