Google Looker Studio Connector
Step-by-Step guide for integrating Similarweb Website Traffic and Engagement data with Google Looker Studio
Overview
Google Looker Studio (formerly known as Google Data Studio) is a powerful tool that allows you to create detailed visual reports and dashboards by connecting various data sources together. With the new Similarweb connector for Looker Studio, existing Similarweb clients with API access can now seamlessly integrate website traffic and engagement data into their Looker Studio dashboards and reports.
This guide will walk you through the process of setting up the Similarweb connector in Looker Studio, provide an overview of the available data points and parameters, and demonstrate how to combine this data into your existing Looker Studio dashboards.
Why Use Similarweb with Looker Studio?
Integrating Similarweb data into Looker Studio provides you with a comprehensive view of your website's performance and your competitors across various metrics. This flexibility allows you to create custom reports that combine traffic data, engagement metrics, and competitive analysis, all in one place. This empowers you to make more informed decisions based on a holistic understanding of your digital presence.
How to Set Up the Similarweb Website Analysis Connector
Follow these steps to integrate Similarweb data into your Looker Studio reports:
-
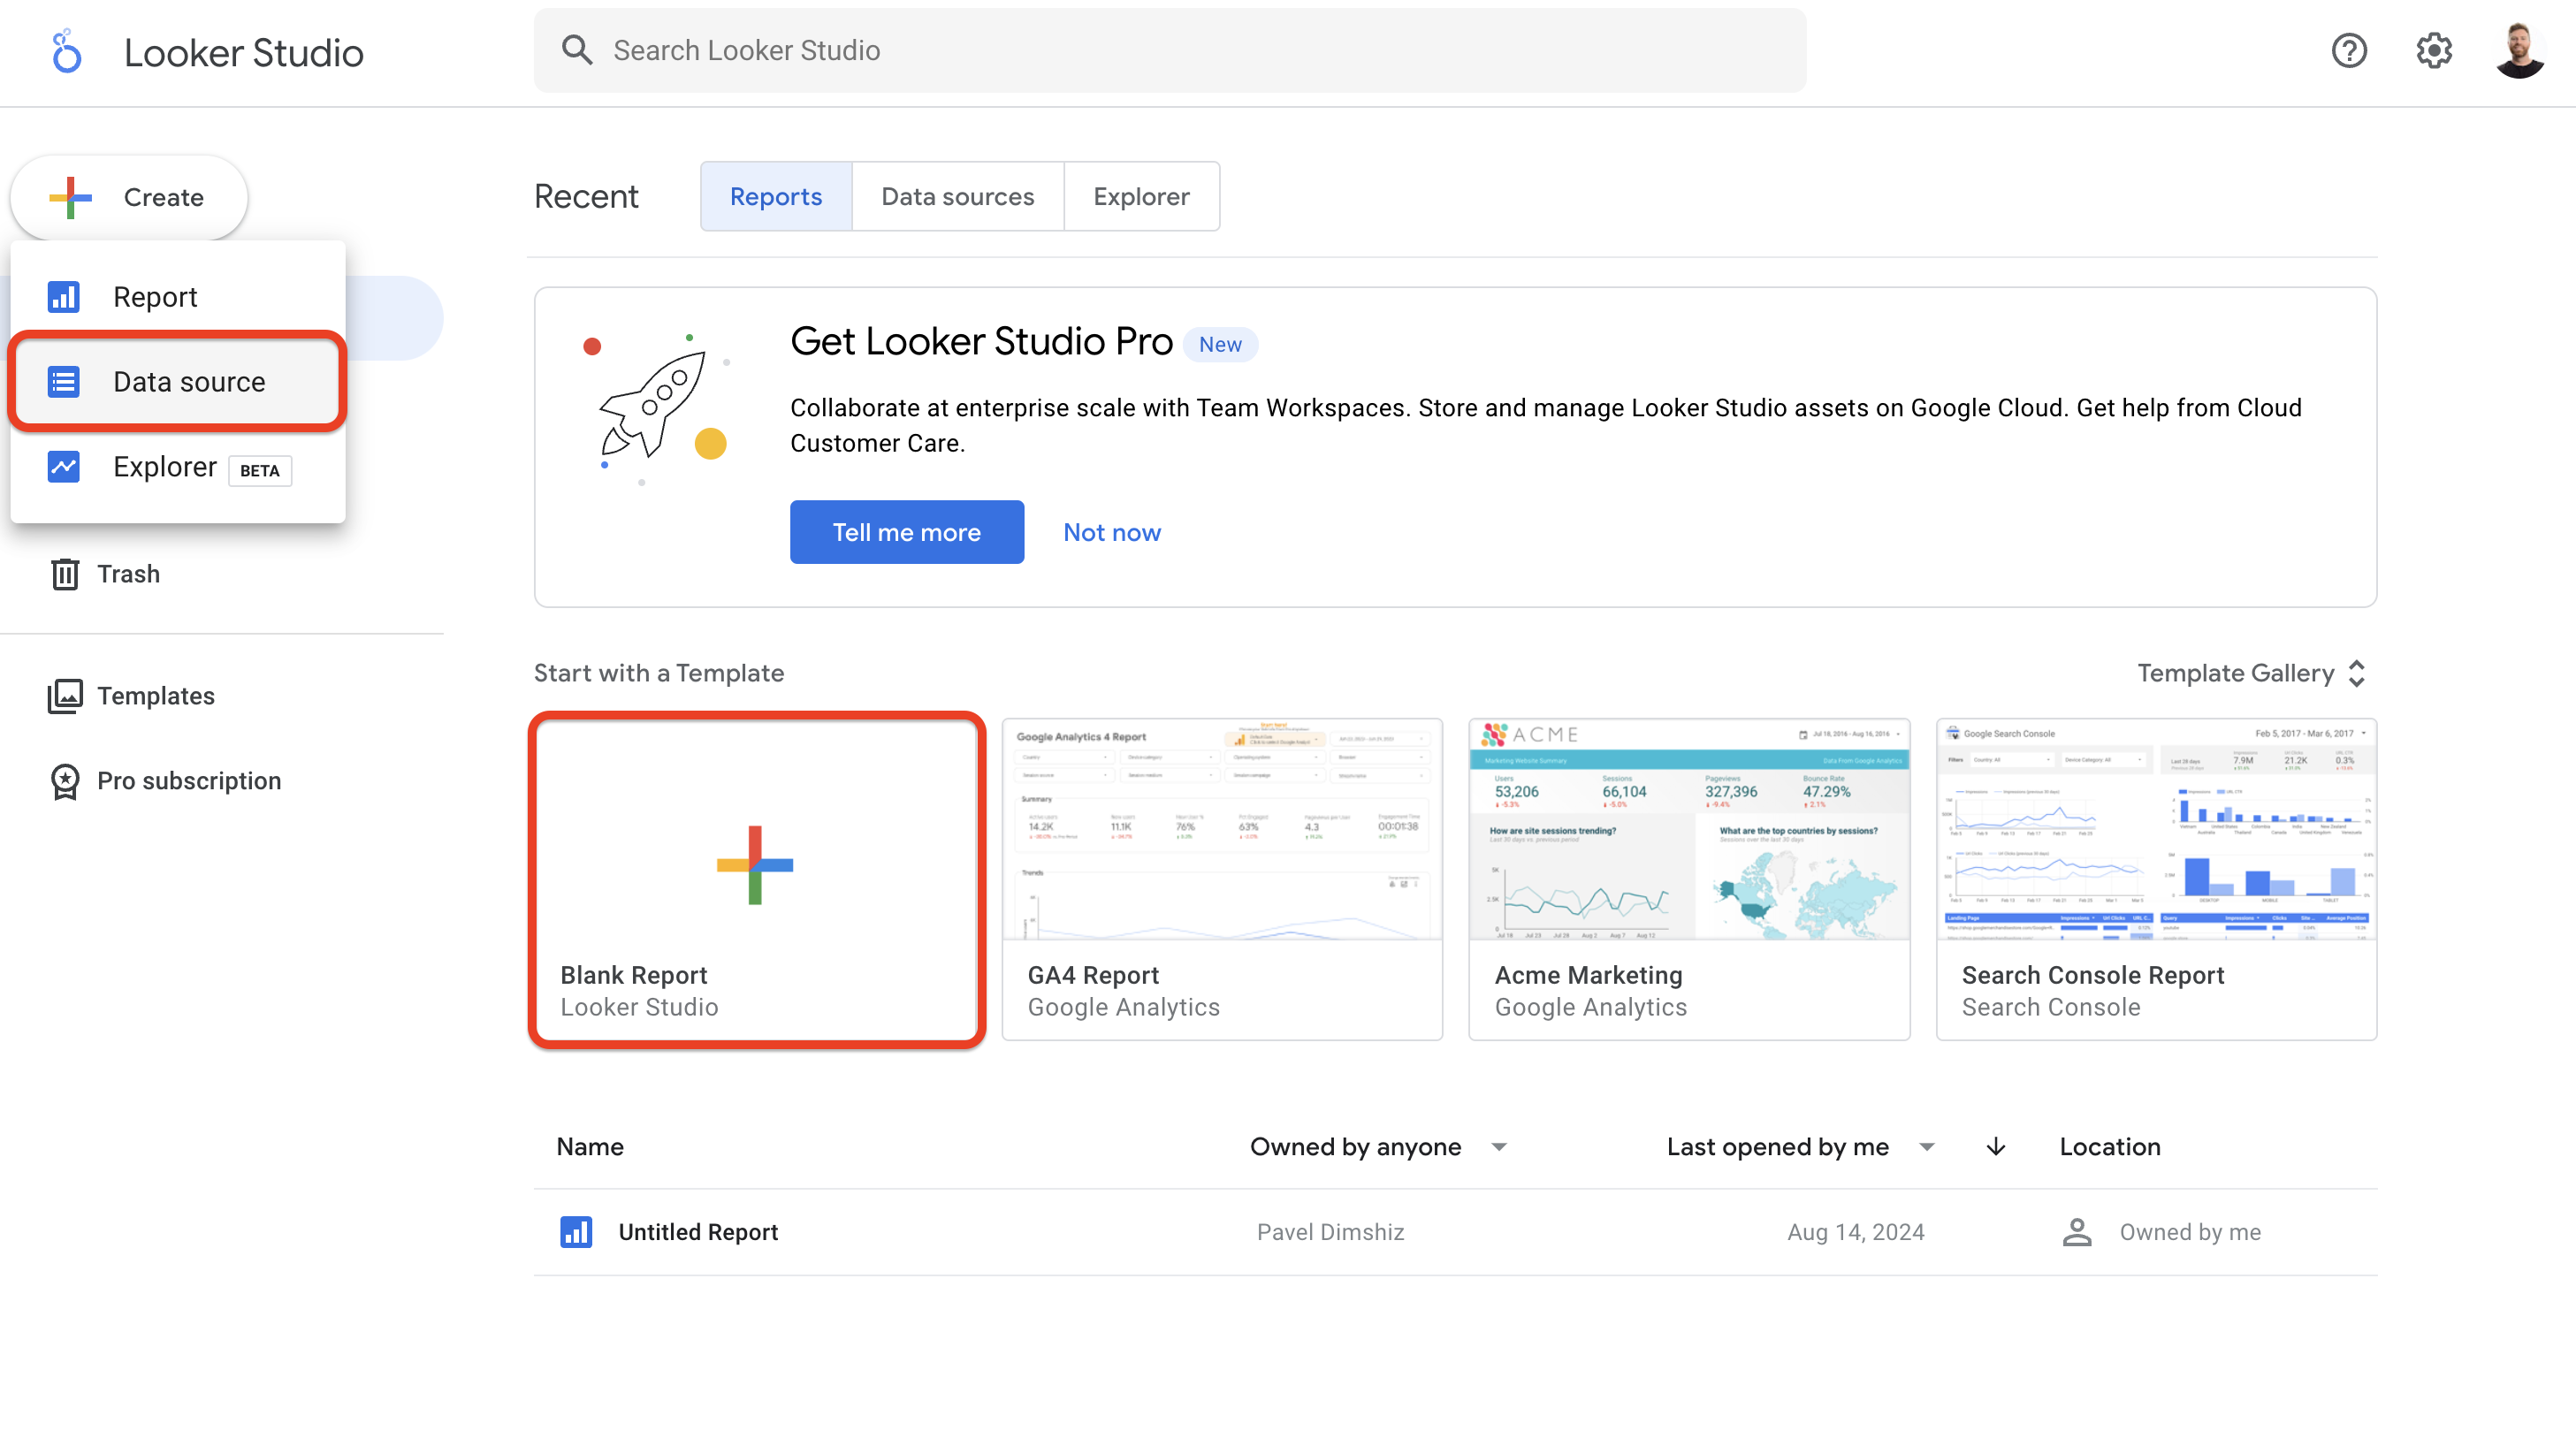
Access Looker Studio:
- Go to Looker Studio and log in with your Google account.
-
Create a New Data Source:
- Click on the Create button in the top left corner.
- Select Data Source from the dropdown menu.
- Alternatively, you can create a Blank Report or use an Existing Report and choose the data source from there.
- Search for the Similarweb Connector:
- In the list of available connectors, search for “Similarweb Website Analysis” and select it.
- Make sure you're selecting the official Similarweb connector.
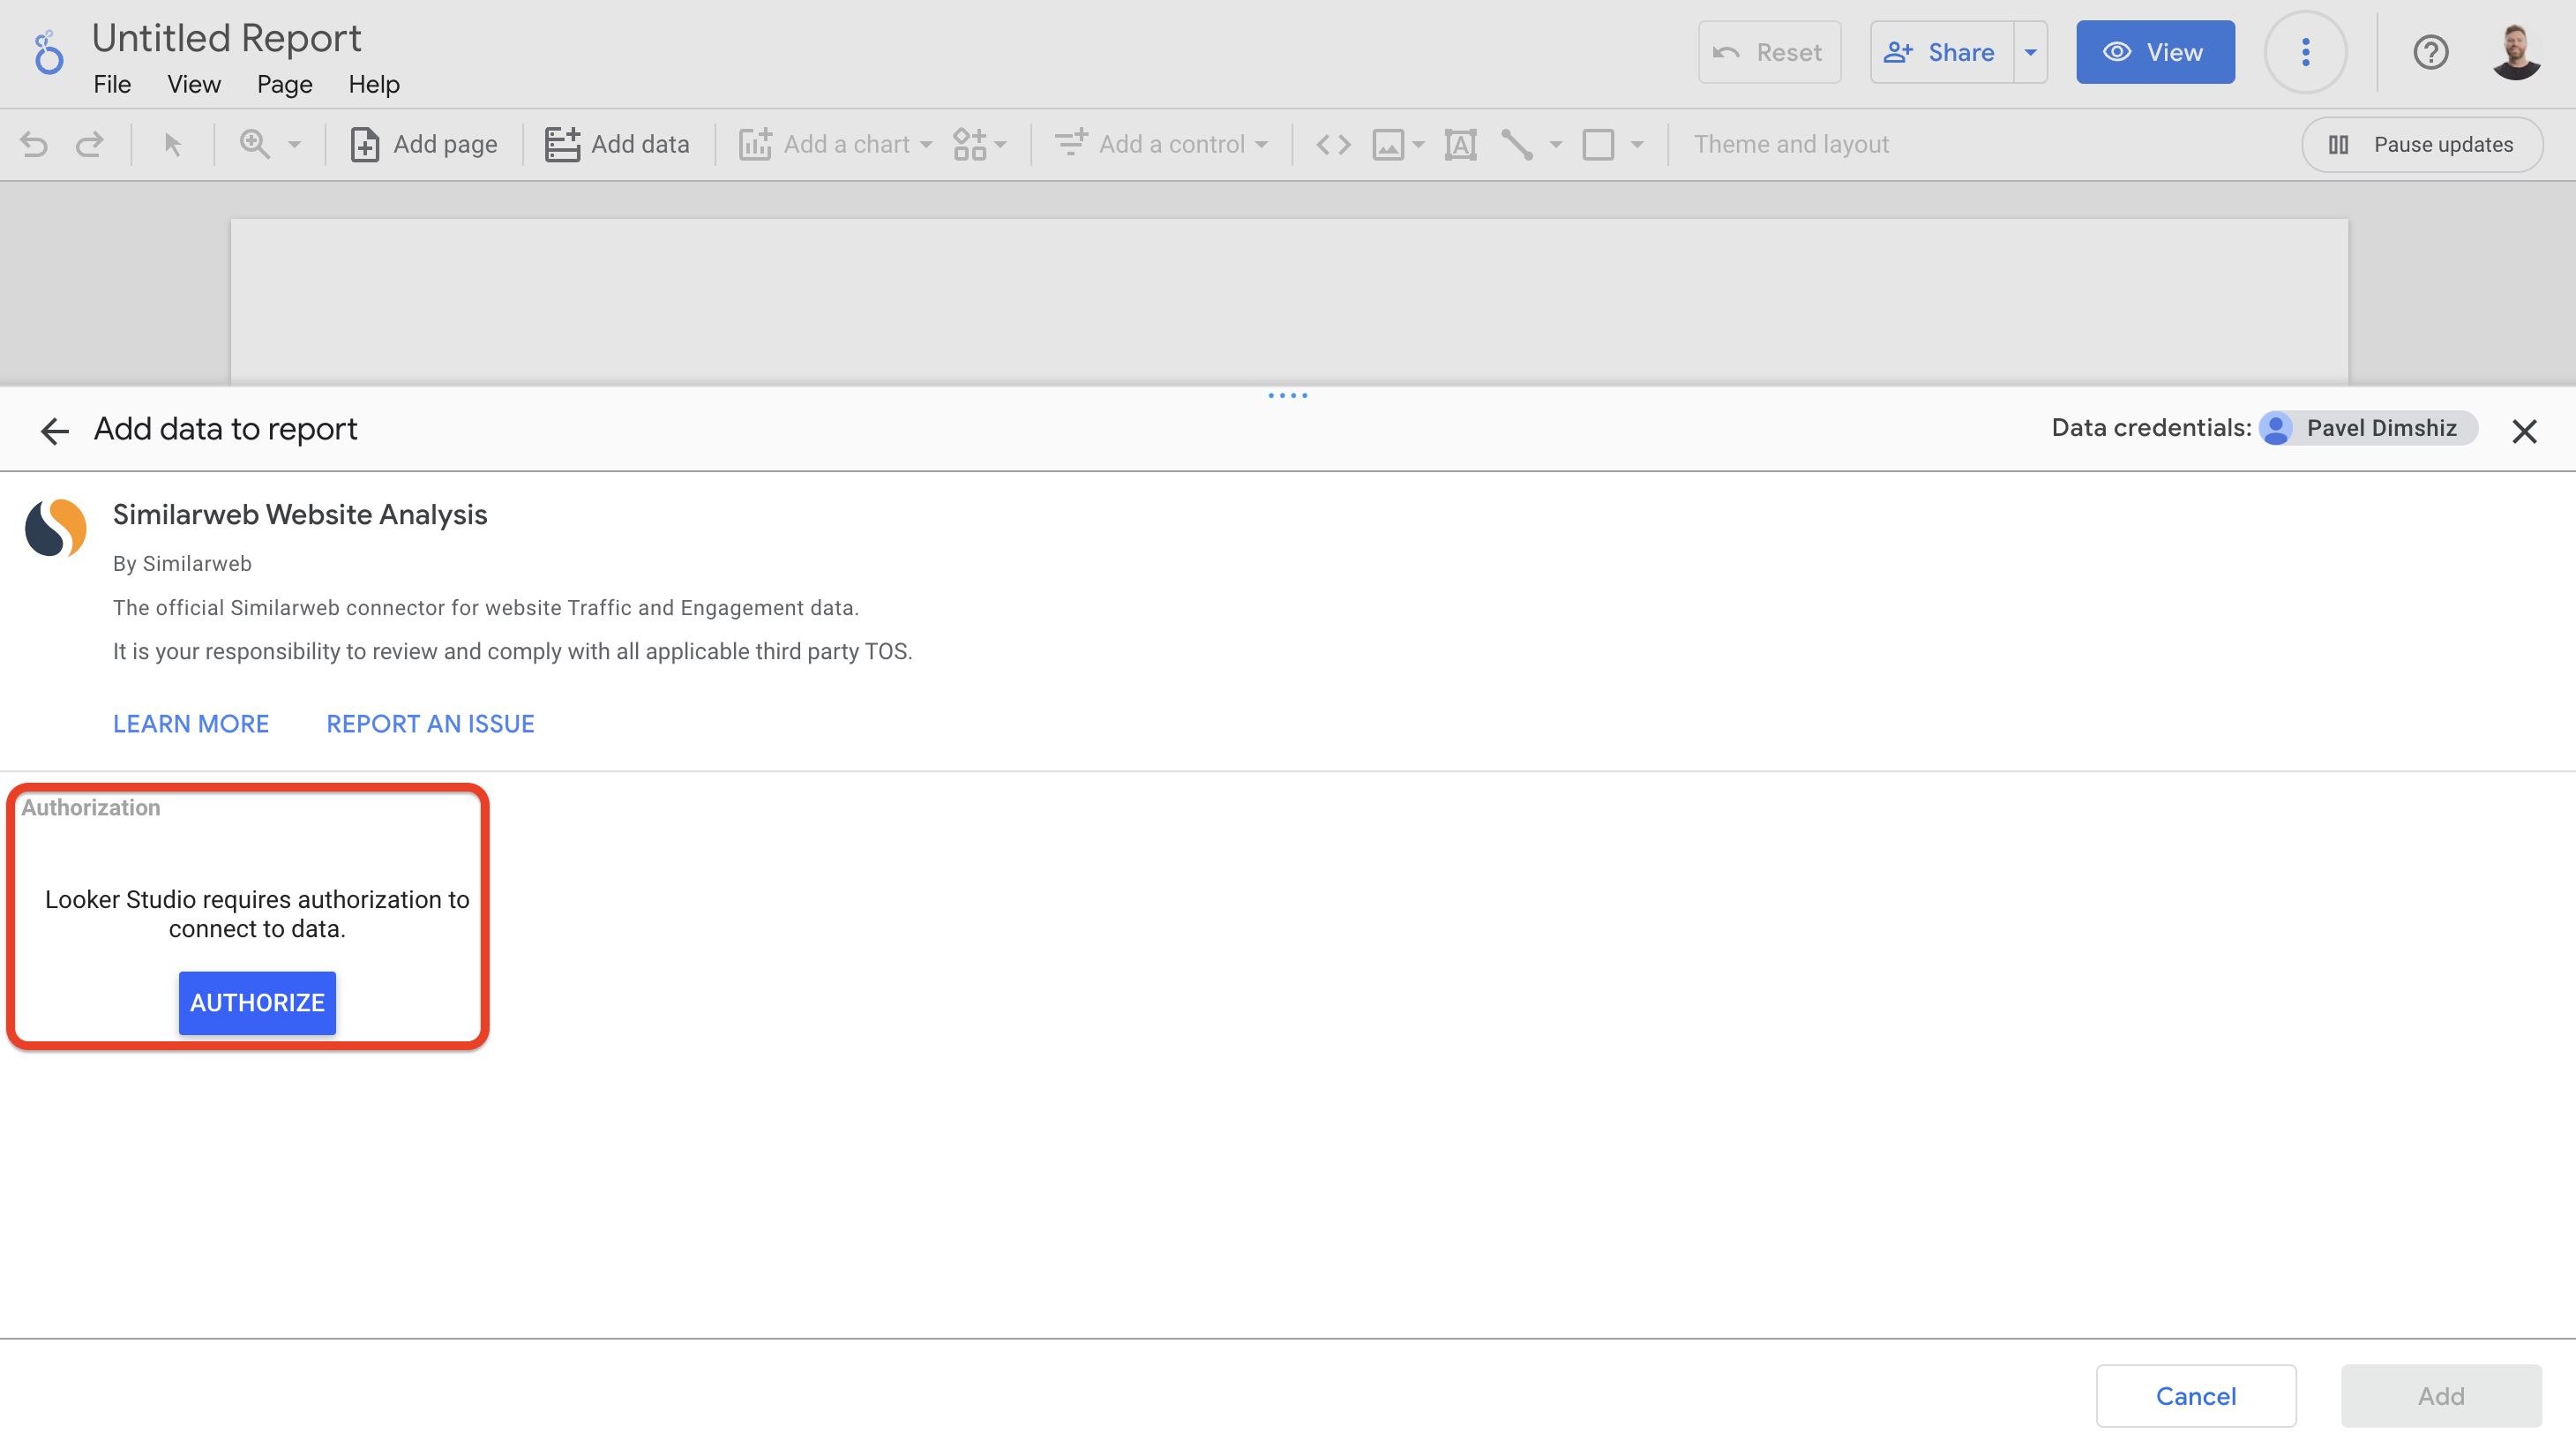
- Authorize the Connection:
- You will be prompted to authorize both your Google account and Similarweb API access.
- You'll now be asked to enter your Similarweb API key. To retrieve your API key, go to the Account Settings page on the Similarweb platform and copy the REST API key you would like to use. Make sure it's activated and click Submit.
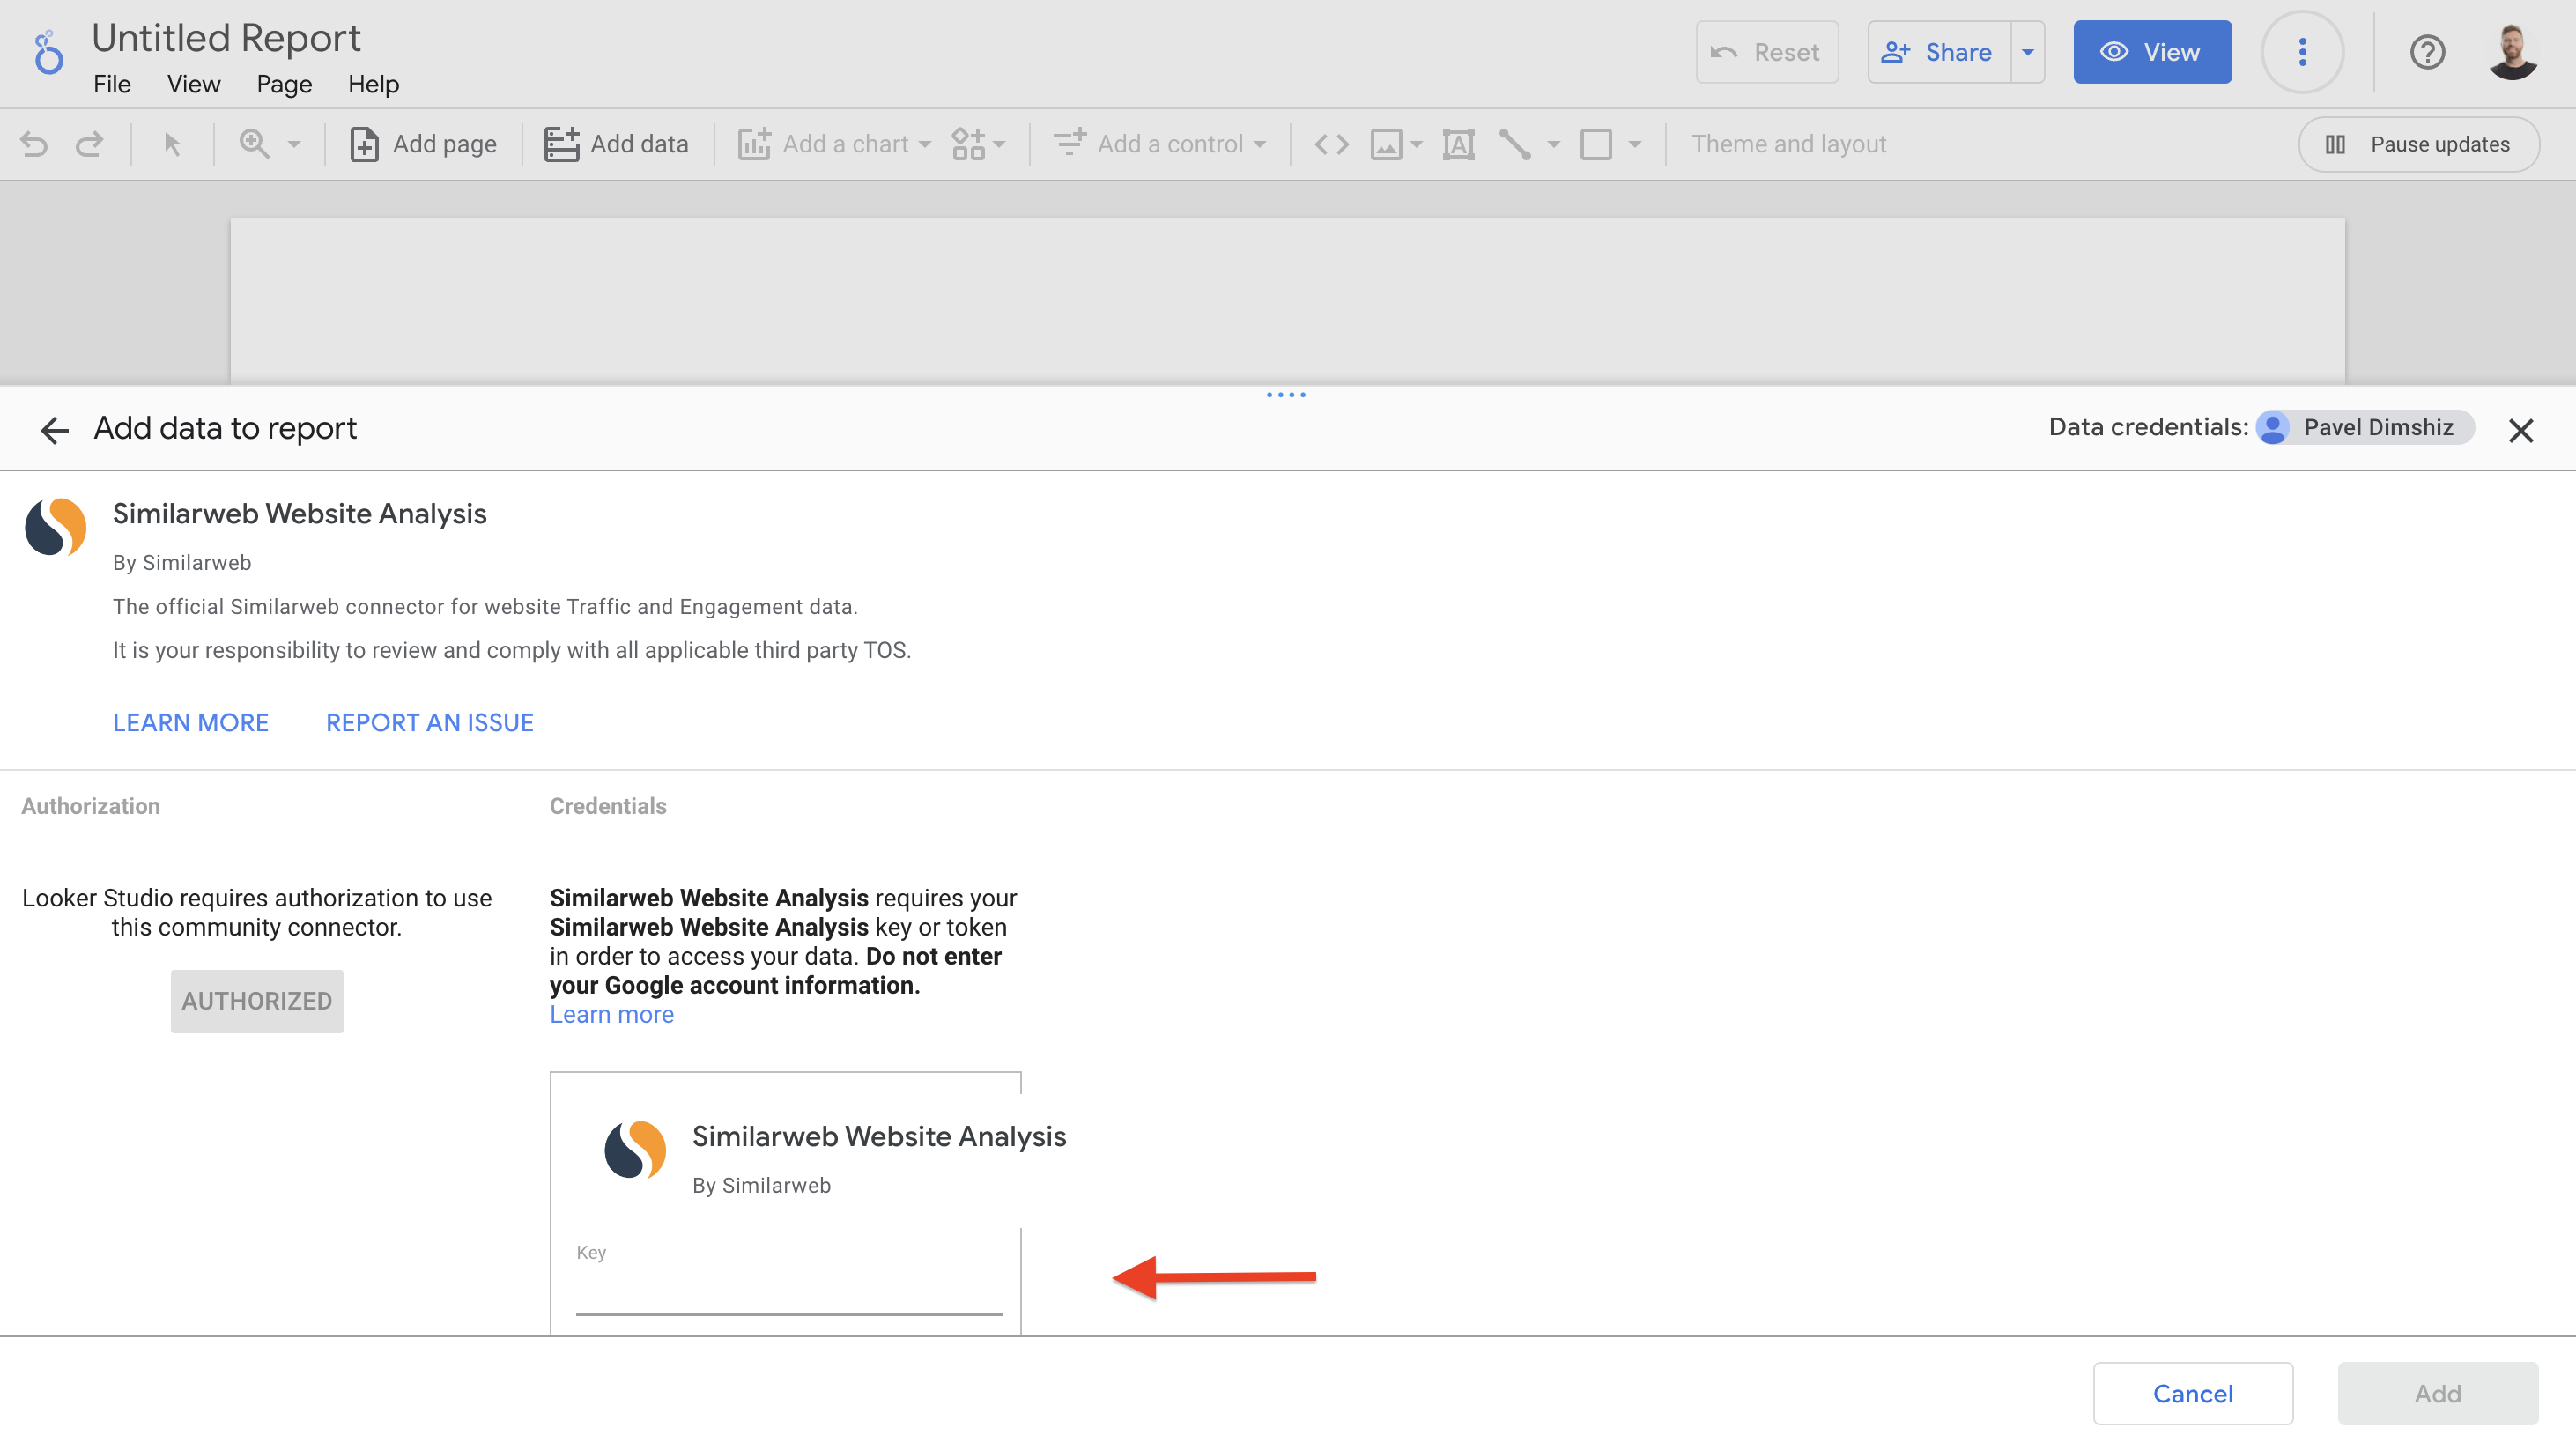
Once the authorization process is complete you will be able to continue configuring the data source.
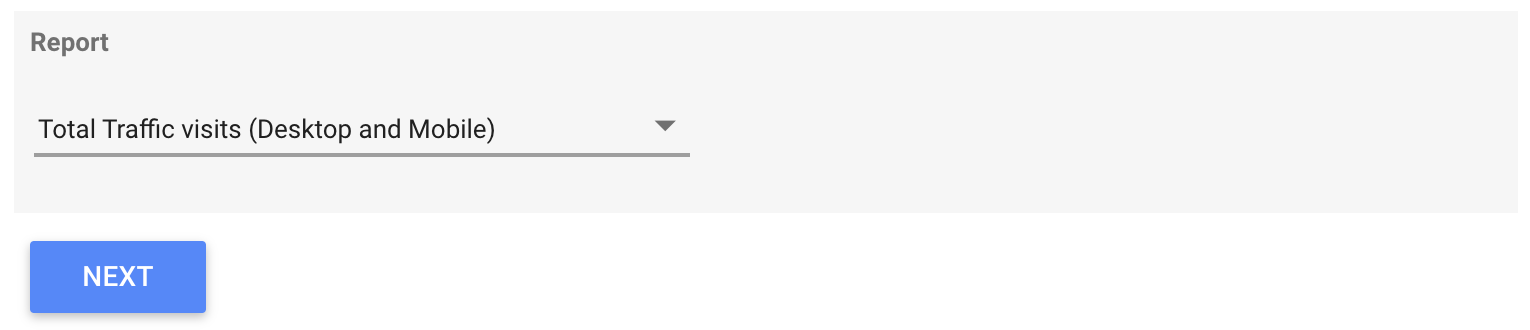
Choosing the Relevant Report (data set):
The Similarweb connector provides a range of metrics that can be pulled into Looker Studio. They are API endpoints that are categorized as follows:
Traffic & Engagement endpoints:
| Endpoint | API Reference |
|---|---|
| Total Traffic Visits (Desktop & Mobile) | View endpoint |
| Traffic Visits (Desktop) | View endpoint |
| Traffic Visits (Mobile Web) | View endpoint |
| Unique Visitors (Desktop) | View endpoint |
| Unique Visitors (Mobile Web) | View endpoint |
| Page Views (Desktop & Mobile) | View endpoint |
| Page Views (Desktop) | View endpoint |
| Page Views (Mobile Web) | View endpoint |
| Pages Per Visit (Desktop & Mobile) | View endpoint |
| Pages Per Visit (Desktop) | View endpoint |
| Pages Per Visit (Mobile Web) | View endpoint |
| Average Visit Duration (Desktop & Mobile) | View endpoint |
| Average Visit Duration (Desktop) | View endpoint |
| Average Visit Duration (Mobile Web) | View endpoint |
| Bounce Rate (Desktop & Mobile) | View endpoint |
| Bounce Rate (Desktop) | View endpoint |
| Bounce Rate (Mobile Web) | View endpoint |
| Deduplicated Audience (Desktop & Mobile) | View endpoint |
| Desktop vs. Mobile Split | View endpoint |
Ranking endpoints:
| Endpoint | API Reference |
|---|---|
| Country Rank (Desktop & Mobile) | View endpoint |
| Global Rank (Desktop & Mobile) | View endpoint |
| Industry Rank (Desktop & Mobile) | View endpoint |
Geographical endpoints:
| Endpoint | API Reference |
|---|---|
| Geography (Desktop & Mobile) | View endpoint |
| Geography (Desktop) | View endpoint |
| Geography (Mobile Web) | View endpoint |
Audience endpoints:
| Endpoint | API Reference |
|---|---|
| Deduplicated Audience - (Desktop & Mobile) | View endpoint. |
Keyword Research endpoints:
| Endpoint | API Reference |
|---|---|
| Branded Distribution by Clicks | View endpoint |
| Keywords Overview | View endpoint |
| Landing Pages | View endpoint |
| SERP Players | View endpoint |
| Website Keywords | View endpoint |
Segment and Marketing Channels endpoints:
| Endpoint | API Reference |
|---|---|
| Segment Marketing Channels - Desktop | View endpoint |
| Segment Traffic and Engagement - Desktop | View endpoint |
| Segment Traffic and Engagement - Total | View endpoint |
| Visits by Marketing Channel - Desktop | View endpoint |
Select the report you want to use and click next.
Configuring the Report Parameters:
- After choosing the desired report, you’ll need to configure the parameters that appear on the screen. Each report has different parameters that can be configured. Here's an example of the available parameters for 'Total Traffic Visits':
- Domain name: Enter the domain you want to analyze. Don't use the "www." prefix when entering the domain.
- Country: Set the country filter from the dropdown menu.
- Granularity: Choose the granularity of the data (daily, weekly, or monthly).
- Additional Options: You can also filter the report using the following parameters:
- Main Domain Only: Specify whether to return values for the main domain only or include subdomains.
- Show Verified: Shows shared Google Analytics data when available.
- Month-to-Date: When selected, the report is set to the latest available days' data (month-to-date).
- Engaged only: When selected, the data is filtered by 'engaged visits' only.
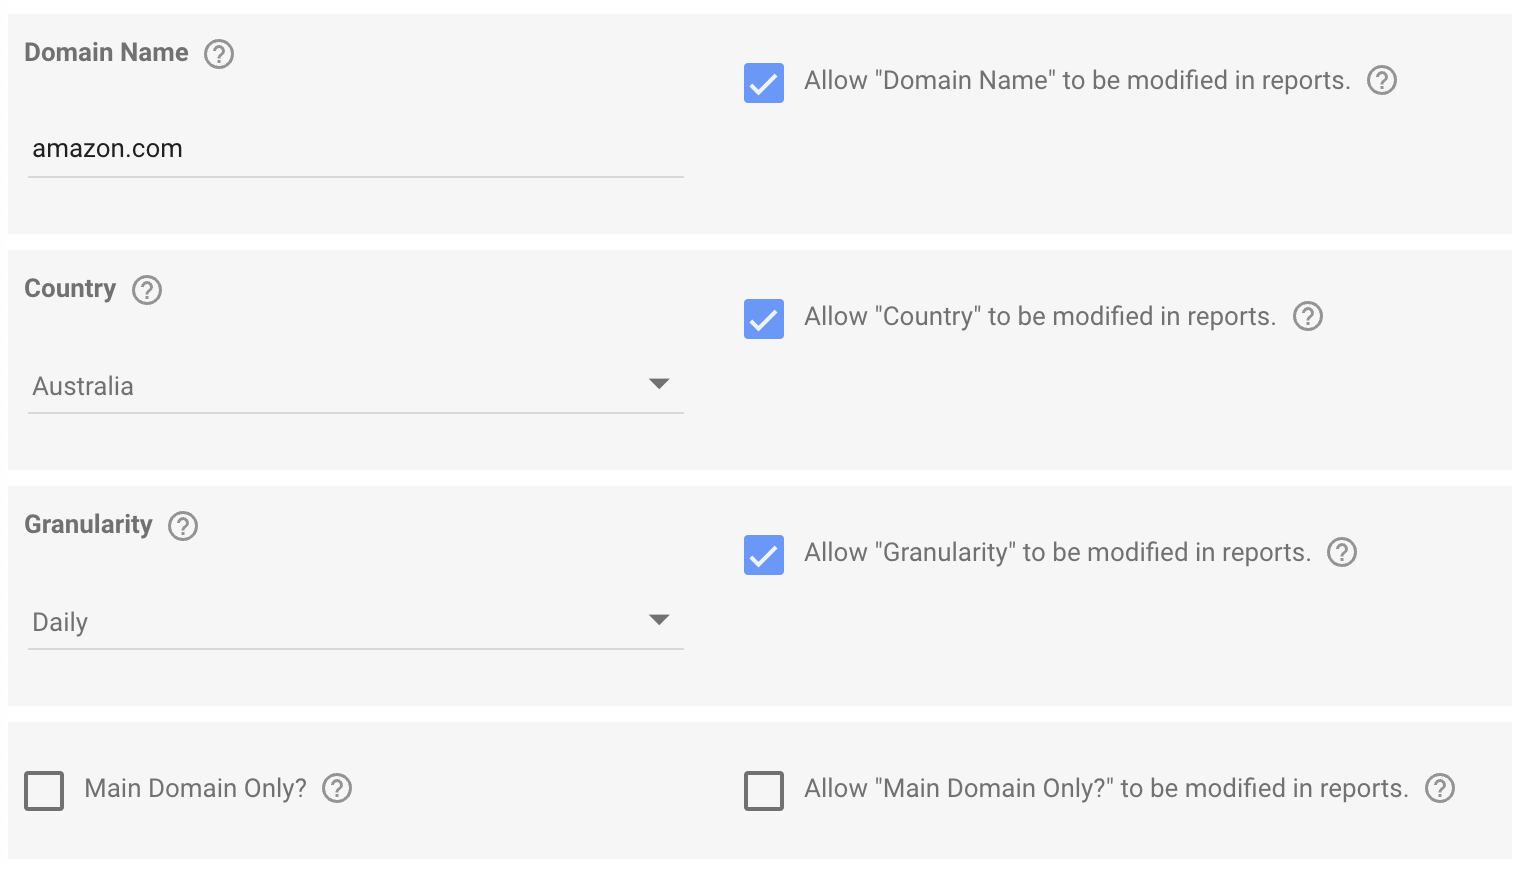
Report Parameters ModificationIf you want to modify the report parameters you need to make sure the checkboxes on the right are selected.
Connecting the Data Source:
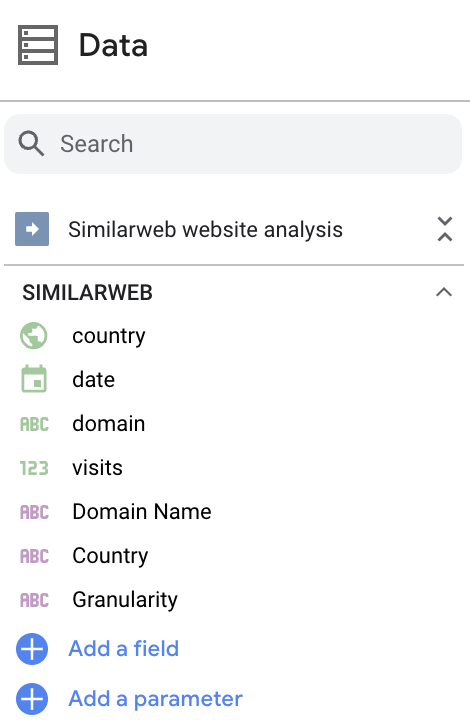
- After configuring the parameters, click on Add. You will now see the data fields available for use in your Looker Studio report.
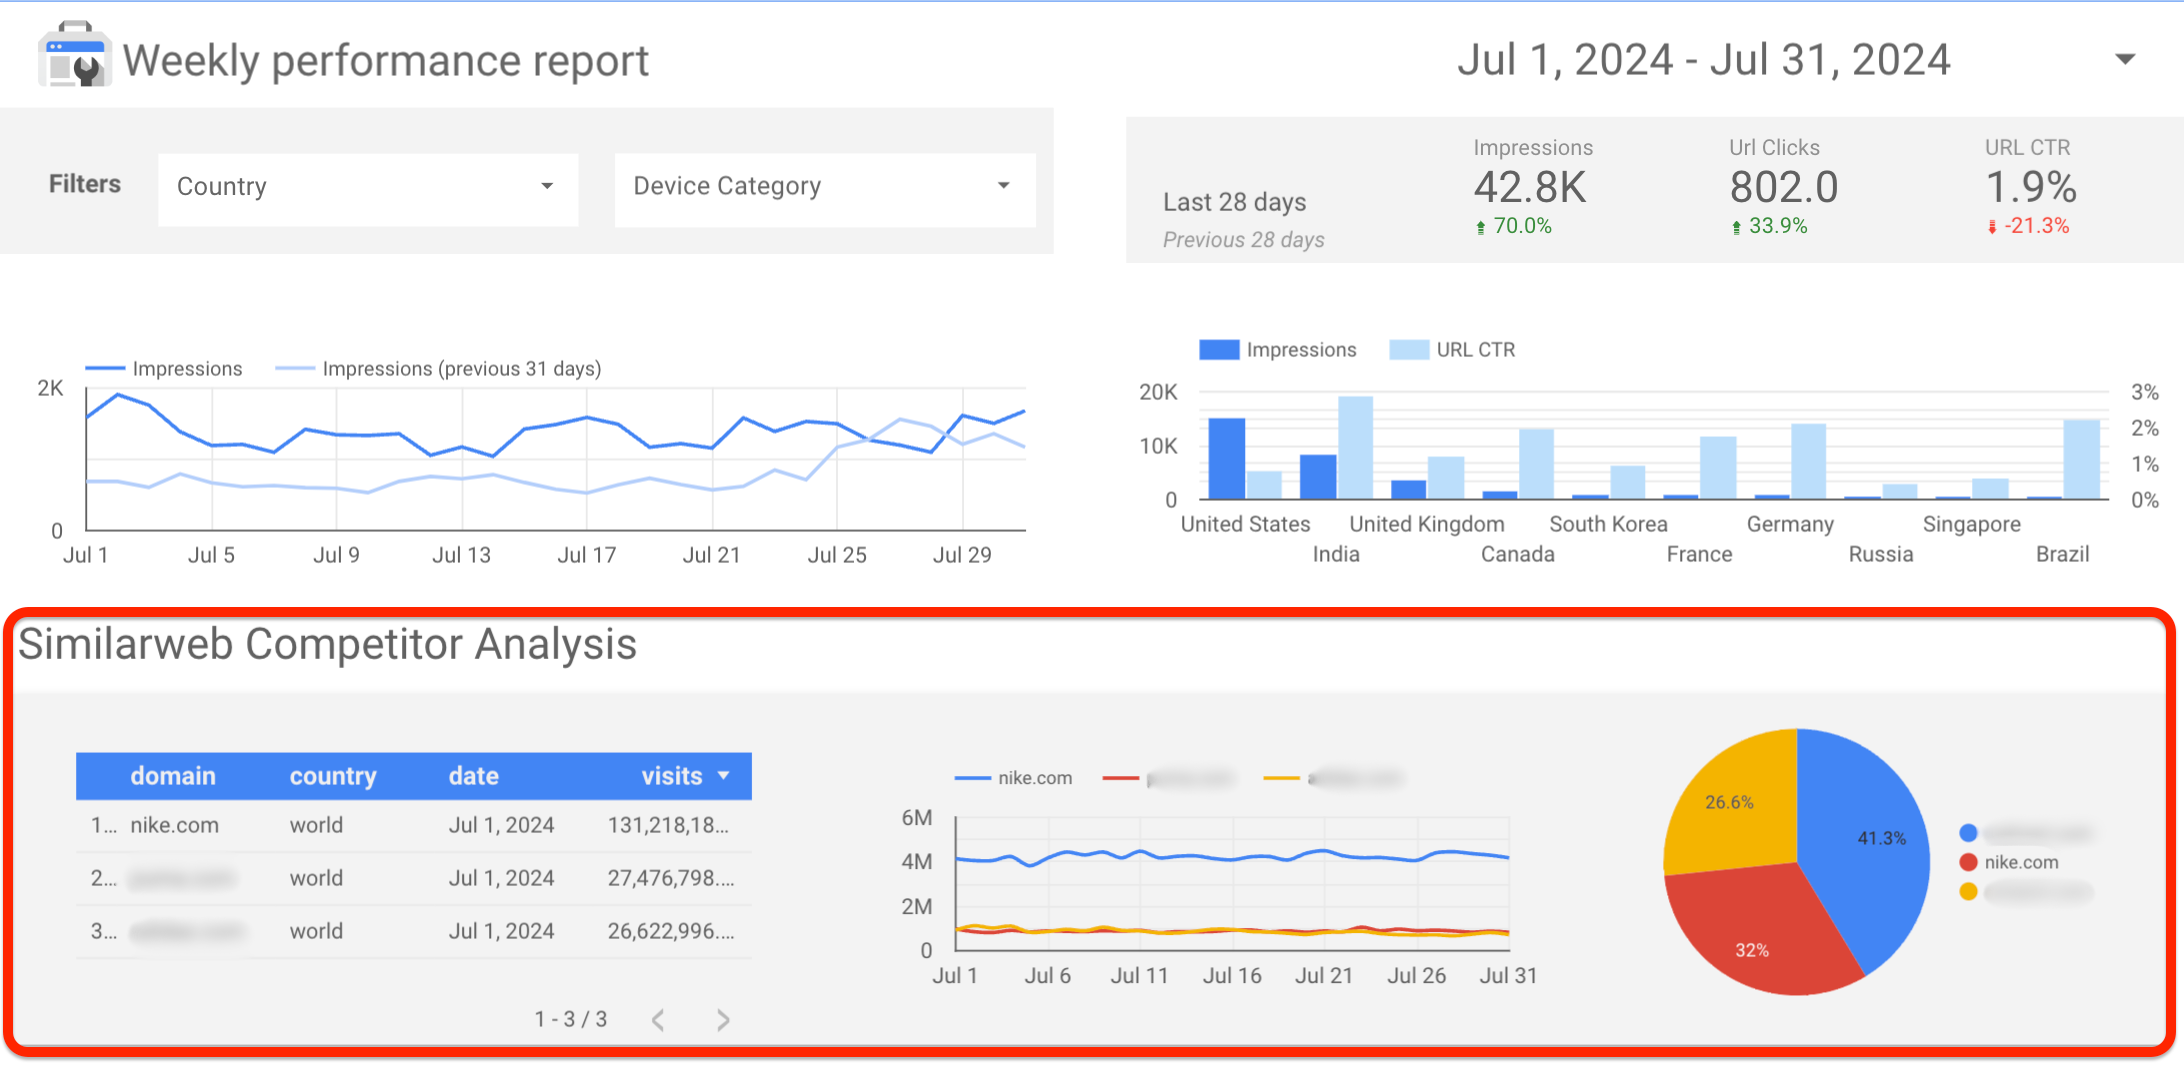
Example: Integrating Similarweb Data into Your Dashboard
To demonstrate how Similarweb data can be integrated into your existing Looker Studio dashboard, we will walk through an example of adding a Traffic Overview section:
-
Create a New Report:
- In Looker Studio, click Create Report after setting up your Similarweb data source.
-
Add a Chart:
- Select a chart type, such as a time series or bar chart, and drag it onto your report.
-
Select Your Metrics:
- Choose metrics like Visits, Average Visit Duration, and Bounce Rate from the Similarweb data fields.
- Customize the chart to display trends over time, split by desktop and mobile.
-
Filter and Customize:
- Use filters to display data for specific countries or date ranges.
- Customize the chart’s appearance to match your report's style.
-
Combine with Other Data Sources:
- Integrate Similarweb data with other sources like Google Analytics or Search Console to create a comprehensive view of your website’s performance.
Sharing Your Report
Once you have completed your Looker Studio report with Similarweb data, you can publish it to share with your team or stakeholders.
For more detailed information about the available parameters and API endpoints, please refer to the Similarweb Developer Documentation.
Updated 29 days ago